03 December 2014
Gold lease rate curve inversion
Following on from Monday's post on this unhistoric GOFO, I've got around my problems with image upload on blogger by putting it up on twitter first.
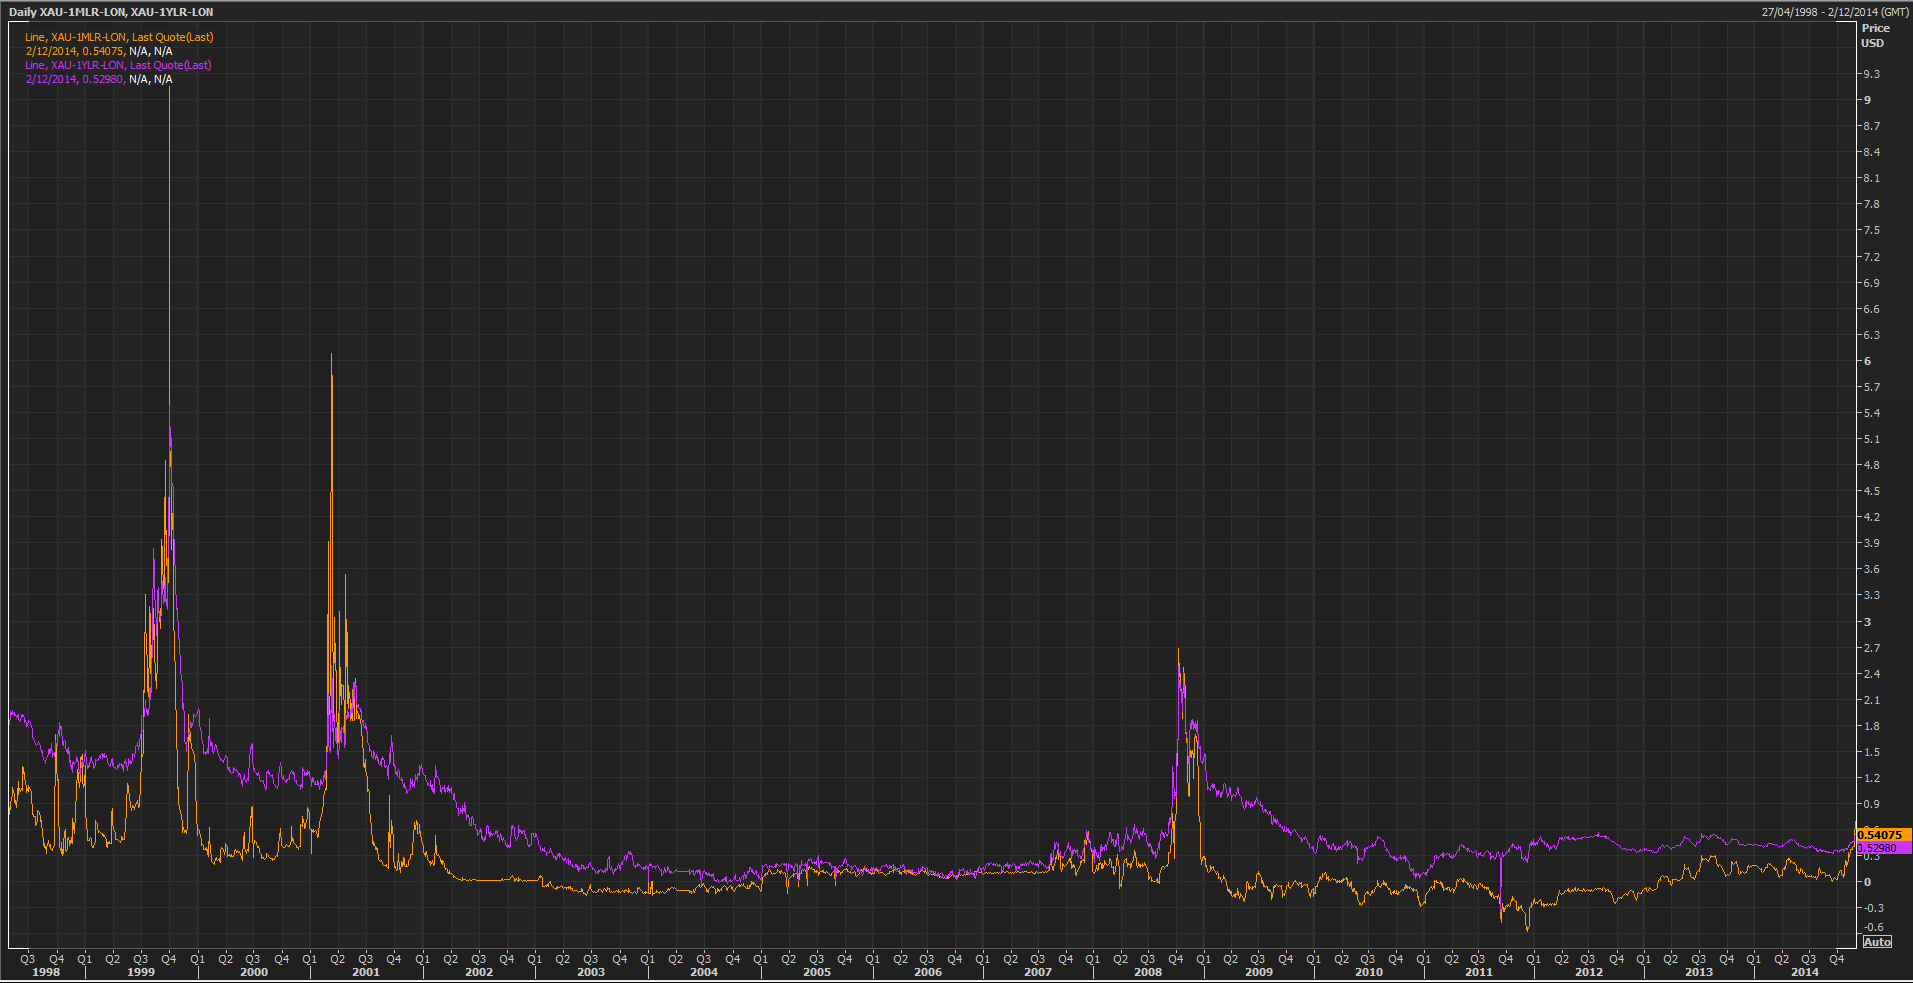
Below is the 1 month and 12 month lease rates back to 1998. I think it is pretty clear that this current situation, while trending in the direction of something historic, is not there yet.
What is interesting is that the gold lease (interest) rate curve has just started to invert, with 1 month rates at 0.54075% while 12 month is at 0.52980%. Such inversions are rare, with the significant occurrences being in 2008, 2001 and 1999.
It is worth noting that during these periods the lease rate spikes lasted for at least 3 months before returning to pre-spike normal lease rates. There is also no correlation with action in the gold price. In 2008 for example, the gold price continued to weaken as lease rates went up during early Q4 2008. In 1999 you can see that the gold price was stable during Q3 1999 all the while lease rate spiked to record highs. So I think it is premature of commentators to spin this high lease rate/negative GOFO as guaranteed indicator of a bottom - history shows that price could weaken further before climbing.
On Monday I gave a number of reasons why we are seeing the action we do. The 2008 experience where the price fell while lease rate were high does suggest shorting. I would note that such shorting action could come from futures markets where speculators see the initial price weakness and then pile in. In such one-sided situations bullion banks will make a market and take the long side and hedge themselves by shorting gold in the OTC spot market. Such shorting activity will result in demand for borrowed gold, hence lease rate rise.
Such a theory means that lease rate spikes (if speculative driven, not liquidity driven) may be indicative of excessive shorting and thus market bottoms. If one saw futures speculative positioning on the short side, bullion banks on the long side and high levels of open interest at the same time as lease rates spiking off recent normal levels, then that could provide strong confirmation of excessive short sentiment.
By the way, Steven Saville has also just blogged on the recent "backwardation", saying much the same as I did on Monday but his post has GOFO and LIBOR charts which show the identical behaviour - worth checking out to see what I was going on about.
02 December 2014
Continuing Sprott PHYS Redemptions
At the start of each month any redemption request lodged on the 15th of the prior month shows up on the website of Sprott's precious metals fund. On December 1st we had 36,915oz redeemed, which would have been related to trading between 16 Oct and 15 Nov. I've posted on this activity here and here.
The table below shows the redemptions by month since they first started and the average daily arbitrage profit/loss a trader could make by buying PHYS, redeeming it, and selling the physical at spot.
You'll note that any month the arbitrage is negative (a loss), there is no redemption, and when it is positive, there is a redemption. The only month that doesn't fit this pattern is August 2014, however, while on average August showed an arbitrage loss, there were 8 days when it was profitable.
It is clear now that this is arbitrage driven activity which takes advantage of any discount to NAV on the Sprott funds. Since PHYS first moved out of a premium to NAV in July 2013 it has lost 19.6% of its gold. As long as there is little retail interest in PHYS to bid up its share price above NAV, PHYS is going to continue to lose metal.
| Date of Redemption | PHYS Gold PHYS Redemption (oz) | Average Daily Arbitrage Profit/Loss |
| Jul 2nd 2013 | 400 | 0.139% |
| Aug 1st 2013 | 8,354 | 0.214% |
| Sep 3rd 2013 | 12,500 | 0.045% |
| Oct 1st 2013 | -0.234% | |
| Nov 1st 2013 | 17,260 | 0.122% |
| Dec 2nd 2013 | 19,200 | 0.144% |
| Jan 1st 2014 | 83,890 | 0.327% |
| Feb 2nd 2014 | 91,680 | 0.125% |
| Mar 3rd 2014 | -0.093% | |
| Apr 1st 2nd 2014 | -0.175% | |
| May 1st 2014 | -0.068% | |
| Jun 2nd 2014 | -0.012% | |
| Jul 1st 2014 | 6,150 | 0.006% |
| Aug 1st 2014 | 12,028 | -0.022% |
| Sep 1st 2014 | 0.000% | |
| Oct 1st 2014 | -0.008% | |
| Nov 3rd 2014 | 27,911 | 0.086% |
| Dec 1st 2014 | 36,915 | 0.077% |
| Total | 316,288 |
01 December 2014
How historic is this negative GOFO?
So is this occurrence of negative GOFO a "Gold Shortage, Worst In 21st Century" as Zero Hedge recently claimed?
Keith Weiner notes that by his strict definition of backwardation (a positive cobasis) there are now four futures contacts in backwardation when "prior to this, the most we’ve seen is three". He considers this serious and suspects "that this time, it’s a matter of price. We believe that when the price rises enough, this backwardation will subside".
JP Koning has an interesting take, suggesting that negative GOFO is revealing the market's "convenience yield", a price businesses in the trade are willing to pay for "uncertainty-shielding services". As he explains:
"Gold merchants seem to be anticipating choppiness in the future supply and demand of the metal, and see growing benefits in holding inventories of the stuff in order to cope with this choppiness. The convenience yield on these inventories has jumped to a high enough level that it currently outweighs the costs of storing and financing gold, resulting in an inverted gold market."
In contrast to Keith, JP notes that gold forward prices are only inverted "over a narrow range of five or six-months. By mid-2015, forward prices return to their regular pattern of trading at a premium to current prices ... So no, gold is not becoming money. Rather, we are running into some short-term jitters, and merchants think that holding the stuff provides a few more ancillary benefits than before".
The more interesting part of JP's post for me, which leads us to an answer to my question, is his observation that "earlier disruptions occurred when U.S. interest rates were already high enough that they continued to outweigh the metal's suddenly-augmented convenience yield. ... Going forward, all gold market disruptions could very well create sharp inversions of -1 to -2% in the 1 to 12-month horizons, insofar as we are living in an era of permanently low interest rates".
To explain JP's point, have a look at this chart from his post below. 
Note the unusual chart pattern where GOFO moves up in a straight line from 2004 to mid-2006, is then flat for a year and a bit and then drops sharply over the next year and a half. I wonder what was going on in the gold market during that time to account for that behaviour?
For the answer go to http://www.lbma.org.uk/pricing-and-statistics and select LIBOR in the chart drop down box. Isn't that amazing, US interest rates during 2004-2008 exhibit exactly the same chart pattern as GOFO.
In actual fact, there was nothing going on in the gold market. GOFO is mathematically equal to US Interest Rate minus Gold Interest Rate. Thus if US interest rates go up and Gold's Interest Rate is stable, then GOFO will rise. If you select "LIBOR minus GOFO" (ie, Gold's Interest Rate) in the LBMA's chart, you will see that it was indeed flat during 2004-2008.
If you look at that "LIBOR minus GOFO" chart you will see that while the interest rate on gold has moved up, it is not "historic", for which we would need to see interest rates above 2% (which at ZIRP would equate to circa -2% GOFO). The only reason current GOFO rates look historic is because cash rates are basically zero. Comparing GOFOs over time is not really comparing apples to apples - the only way to look through the effects of ZIRP is to look at gold's interest rate. It is like looking at cash interest rates during the 70s and 80s and noting how much better depositors were off compared to today because bank deposit rates were 15%, and completely ignoring the differing inflation rates between now and then.
This then leads on to the question of why would lease rates be rising (or it could be GOFO falling, it is hard to tell which market is in the driving seat sometimes)? I've said this a few times, but there are only two things you can do with borrowed gold:
For the second reason, sell it, this basically means that people are shorting gold. It could be speculators, or maybe miners have resorted to hedging again (I note there was a 55 tonne increase in the global hedge book in Q2 2014). Consider that when miners stopped hedging and started to reduce their hedges in 2002 that gold interest rates crashed to their current low levels.
So while Zero Hedge may spin a falling GOFO as bullish, it could be indicative of a rising interest rate on gold, which could be an indicator of short selling/hedging, which would result in a falling gold price. And what has gold been doing recently? I'm not saying this is the explanation, mostly likely all the explanations mentioned in the last two paragraphs are in play, we just don't know which is the main driver at this time, but at least here you will get some of the negative explanations to weigh up.
- hold it
- sell it
28 November 2014
With friends like these
On Sunday the Swiss vote on the "Save our Swiss Gold" initiative. If you solely consumed gold blogosphere content, you think this brilliant proposal still has a chance of succeeding. The reality is that the proposal:
"I was actually in Switzerland a couple of weeks ago - and no one - outside of the gold traders I met with - had even heard of it - I asked waiters, bar men, taxi drivers and hotel clerks etc - even some old friends that I had a drink with when I was there - and literally not one had heard of it."
It seems mainstream Swiss attitudes towards gold have only weakened further since they voted to remove the link between the Swiss franc and gold in 1999. Given that political reality, you would think it would be wise to put forward a modest proposal that would provide as small a target as possible.
But no, goldbugs do not know such restraint and so it was with dismay when I read the proposal and its moronic ban on any gold sales by the Swiss National Bank (SNB). As many commentators and the SNB itself noted, this restriction in combination with the 20% minimum would "mean that gold eventually accounted for the bulk of the SNB's assets - it would be obliged to buy gold every time its balance sheet expanded and to sell euro every time it contracted."
If the drafters of the proposal had just required a 20% backing ratio, it would have a much better chance of being approved. A ratio requirement would have cut away a key argument against it (lack of monetary policy flexibility) and would have accorded with basic portfolio management, which is to choose an asset allocation and then constantly rebalance. Such a policy would have been a lot easier for the average voter to understand. Indeed, even within the pro camp there were concerns, with Zurich economics professor Hans Geiger saying that:
"the absolute ban on selling gold in future is doubly wrong." First says Geiger – who has long supported the initiative – the SNB should be able to reduce its gold reserves if its balance sheet shrinks overall. Secondly, "If Switzerland were to face crisis, it must be able to use the central bank's gold."
Unfortunately for gold advocates, the pathetic insecurity of the goldbugs behind this proposal meant that they only wanted the SNB to buy buy buy and never ever ever sell. I was going to ask whether those behind the proposal themselves personally follow the investment strategy they expect the SNB to implement, but they probably do hold 100% of their investments in gold.
I have seen commentary arguing that the point of the proposal is to restrict the SNB, particularly in its 1.20 floor policy. However, as Barclays notes, "the gold initiative’s imposition of balance sheet costs would encourage the SNB to pursue “balance sheet light” policies like negative deposit rates instead". Probably not something the proposal proponents thought about, or would prefer.
In any case, even if it was the correct thing for the SNB to end up with 100% gold backing and that was the end objective, it was still politically naïve to go with the never sell requirement. Politics is about the art of what is achievable, about compromise. One is never going to move an electorate from one extreme to another in one step. Yet such nuance is beyond one-eyed goldbugs who feel oppressed and thus must have it all, now.
Keith Weiner, noting the Swiss banks' euro-denominated loans, concluded that the proposal would impose "a bitter dilemma on the Swiss people. They have a choice of slow losses by devaluation, or total losses by bankruptcy. They deserve a better option, a practical roadmap to the gold standard. It’s great that the Swiss people are striving to move towards gold. I am a passionate advocate of the gold standard, and I want to cheer for my Swiss friends. Yet I must caution them today. I realize they have spent a lot of money and political capital to come so far, but I don’t want to win this battle and lose the war."
Unfortunately I think that political capital has been wasted. When gold has friends like these, who needs conspiracies of price suppression.
- is a wasted opportunity due to a stupid fatal flaw;
- has little public awareness and is unlikely to pass.
27 November 2014
Lies, damned lies, and supply & demand figures
Warning: this post is wonkish, those who get annoyed at nit-picking or ambiguity should stop reading now.
Thanks to the beneficence of 19 gold miners, every quarter the World Gold Council (WGC) provides free of charge its Gold Demand Trends report. Despite the inclusion of "manager" in my highfalutin title, I don't actually manage any data monkey lackey staff so for years I've keyed in the Thomson Reuters GFMS sourced supply and demand figures from the report into a spreadsheet myself.
As part of their report, the WGC provides a table of supply/demand figures not just for the current quarter, but also for 2 years worth of prior quarters, so one can see the trends in the figures. What I have noticed is that with each report the figures of the prior quarters change. To see what I mean consider the image below.
 On the right are the figures for Q4 2012 as reported on February 2013. I've highlighted in green the 336.6 tonnes of bar and coin demand. On the left is part of that same table from the November 2014 report, from which you can see that the Q4 2012 bar and coin demand is now being reported as 380.8 tonnes. This means the originally reported figure was 13.1% lower than the now more accurate figure. If you compare the two columns you can see that almost all the figures are different.
Now you may think that I have cherry picked a particularly bad example but this sort of variance is not unusual. Below is a table that compares the originally reported figures with the latest figures the WGC reports, showing how much in percentage terms the original figures were under/over to the more accurate later figure (I have focused here on those categories which are more significant from a tonnage point of view).
 These sort of variances really shouldn't be a surprise - the global gold market is large and opaque and so to come up with figures within a month inevitably estimation is required. As various country statistical and customs departments release official figures GFMS would be able to cross check that with their other sources and surveys and revise their initial estimates accordingly. As governments aren't known for speed, continual revision of the figures is required. What is interesting is that it appears GFMS consistently underestimate the figures (being conservative).
Some additional comments (keep in mind these figures are global, so getting numbers across the entire world isn't easy):
- Mine Production - not surprised to see low variability here, given mines are generally consistent producers and GFMS can also access mine company reporting to analysts and refiner surveys for cross checking.
- Recycled & Jewellery - a bit more variability here as we have a large number of businesses involved that can't all be surveyed, or would want to report.
- Retail Bar & Coin - I am surprised by the variability here, possibly there was some methodology change in later years, but again with many manufacturers across the globe it is going to be hard to get this right within a month of quarter end.
- ETFs - I suspect these variances are due to GMFS expanding the limited list of ETFs they were using in early years and recalculating the figures accordingly.
- Official Sector - this is not surprising given that official reserves reporting is unlikely for many countries to be done within a month of each quarter so I expect there is a fair bit of estimation in these figures to start with.
26 November 2014
Gold blog writing for fun and profit
Below is a confidential email that has been forwarded to me from an anonymous whistleblower. It seems times are tough out there in gold blog land.
From: John Winklebottom [mailto:john.winklebottom@goldblogadvisors.com]
Sent: Tuesday, 25 November 2014 9:00 AM
To: [redacted to protect name of whistleblower]
Subject: Surviving these tough times
I have been receiving a lot of emails from you my customers of the Gold Blog Advisors "Pumping for Profits"(tm) system. I hear your pain. There is no doubt that this prolonged gold bear market and recent break of $1180 has finally caused a lot of your readers to actually question your content.
Apparently for one guru things got so bad with negative feedback and public questioning on his site that he had to shut down comments completely. Now that is an extreme measure and not one I would recommend as public commenting and forums are a great way for those who have bought into your particularly shtick to help groom newbies to accept your pronouncements and sign up. Academic studies have shown that "theories and facts contradicting existing beliefs are conveniently misinterpreted, treated as insignificant" and belief perseverance is ubiquitous, but only if the newbie has first taken on the theory! Removing the ability of newbies to interact will work against them assimilating your ideas and keep them open to other contradictory ideas, which will reduce signup conversion rates. But desperate times can justify desperate measures.
However I would like to emphasise that this is just a temporary problem. Yes you will lose subscribers/readers as market reality bumps up against your shtick but remember in this game you have a fair bit of turnover anyway so it has always been about the newbie funnel and continual conversions. OK right now the flow of new newbies into your sales funnel is low but they will return once the price recovers and these newbies will not know about, or bother to check, any of your past failed predictions or theories. You just need to hold on for the good times to return, which they will.
Now I can hear you saying "yeah that's great but what do I do right now to retain readers and increase conversions on the few newbie suckers that come my way". I think this is a good time to get back to the basics, so lets go over some key strategies that I have advised you on in the past.
First up is Content. Now you all have memes you specialise in but I think you have to be a bit more careful these days to not be too far from reality - don't overestimate the stupidity of your readers. Reconsider your meme rotation list and drop those that are far too bullish in tone or rework them down a bit. I think these memes are particularly worth focusing on at this time:
"People love sensational stories. They like to pass on tales that make the listener very happy, disgusted or afraid: anything that provokes a strong emotional response. Neutral stories, which are probably more likely to be true, but much more boring, therefore get short shrift."
While unique content or spin is key to getting readers, with such little news flow it is OK to pick up memes from other bloggers and rewrite/respin - the echo chamber effect helps us all but just don't get too plagiaristic.
The rewrite/respin point leads on to the next key which is Headline. We have all seen cases where a repost/respin got more clicks than the original article due to a superior headline. A good headline is also crucial to cut through - there is so much content out there that your potential readers are unlikely to look any further than your article's headline, so it has to work. Remember to keep it below 65 words otherwise you'll get cut off in search results, with Twitter you have a bit more room to move.
There are a lot of websites with advice on how to write the ultimate headline, see here for a good example, but these are not precious metals specific. To help you out I have looked at the work of The Master, taking 2,773 headlines from King World News and removed the words "gold" and "silver" (which obviously dominate) as well as the names of interviewees. Below is the resulting word cloud (click to see larger image).

If you work from this list I don't think you can go wrong, it certainly works for KWN.
Before I close, just some administration. Gold Blog Advisors renewal notices for 2015 will be sent out shortly. In the past few years many of you did not go with my Variable option, where you pay based on number of subscribers to your site, and instead picked the higher priced Fixed option. I suspect many of you thought that you would save because you were only paying me a fixed flat fee while your subscriber numbers were going to go up as gold price shot to da moon, but if you had chosen the Variable option you would be paying a lot less now. I think that those who went with the Fixed option fell into the trap of believing your own bullshit that the market would turn around and so would your subscriber numbers. Believing your own bullshit is very dangerous in this business, not just financially but also mentally. I do not need to mention those gold blogosphere names we all know who have fallen into this rabbit hole. Keep this in mind when filling out your subscriptions for next year.
OK. So there you have it, keep your chin up and remember what I always say: Keep Your Content Confident and Crazy.
Sent: Tuesday, 25 November 2014 9:00 AM
To: [redacted to protect name of whistleblower]
Subject: Surviving these tough times
- China - you really can't go wrong with anything on China and how much gold they are buying, the punters love it.
- Paper-physical disconnect - this one should still work even though coin premiums are low, just pick some silly price on eBay to contrast to spot or spin it that there are physical deals being done under the counter at much higher prices. Selective highlighting of online stores being out of stock can also support this meme.
- Blame it on manipulation - this is a great standby if you were silly enough to not make a generalised claim about price and got too time or figure specific.
- Level It - leave details essential for understanding true meaning out
- Sharpen It - make remaining details more specific
- Assimilate It - fit it to readers' frames of reference, they will condense or fill in gaps to give themselves a simpler, more significant configuration
If you work from this list I don't think you can go wrong, it certainly works for KWN.
25 November 2014
The Answer
I was talking to Alex Stanczyk of Anglo Far-East this morning and he said that when he read Ben Hunt's work on narrative it hit him like a brick, being so relevant to gold. He and I agree that gold is very much a narrative driven market, a pure epsilon asset. Others however react negatively to this idea, feeling it is mumbo-jumbo.
The reason I think is because many can't handle ambiguity or the ability to hold two opposing ideas in mind at the same time(1). In an uncertain world, in a complex world where hyper-specialisation means it is impossible for the average person to understand how systems work (financial particularly), it is not surprising that many seek the metal comfort of absolutes and simple truths.
Anyway, a long way to get to Ben Hunt's latest article, which focuses on oil. A lot of what he writes on oil I found myself agreeing could be applied to gold:
I don't think it is coincidental that gold attracts a fair share of such black and white thinking - gold itself is chemically inert and valued over centuries and cultures so has this timeless absolute nature about it.- multiple explanatory factors
- the demand for "The Answer"
- the competition to provide "The Answer"
- the idea of "arriving at a useful assessment of what’s going on, not a Platonic effort at uncovering some eternal Truth with a capital-T"
- that "there is no Answer. In a structurally unstable market, there is no stable deterministic model of discrete market-exogenous factors like global supply/demand and monetary policy to 'explain'" gold prices.
16 November 2014
135 years of US Fed Earmarked Gold
Inspired by this post by Koos Jansen, which included a chart back to 1999 of earmarked (custodial) gold held by the US Federal Reserve Bank for other central banks, Nick Laird at Sharelynx went sleuthing for more data and was able to pull together from multiple sources data going back to just before 1880.
The resulting 135+ year chart of the US Fed's custodial gold, as well as the US' gold reserves, provides a fascinating insight into gold's monetary role. I have an article in the latest journal of the Gold Standard Institute featuring the chart and providing some commentary.
One of the more interesting periods is 1950 to 1965, during the Bretton Woods. While the total amount of gold held by the Fed over these 15 years was relatively stable at 25,000 tonnes, in 1950 only 15% of the gold stored in the Fed was owned by foreign central banks but by the end of 1965, 48% of the gold was owned by foreigners. Any guesses why?
Also of interest is the spate of recent withdrawals, which Koos Jansen has speculated are repatriations by Germany. Since June 2013, 75 tonnes has been withdrawn and if all are related to Germany, then they are on track with their plans to transfer 150 tonnes from New York to Frankfurt by 2015 and another 150 tonnes by 2020.
You can find my article the Gold Standard Institute's November journal here.
13 November 2014
New blog by an ex-RBA gold sale/leasing analyst
Steve Ellis, a fund manager for Baker Steel Capital Managers, just let me know he has started a new blog Gold Market Macro which will focus on "gold lease rates, physical gold premiums and the phenomenon of backwardation in gold".
Normally another blogger on gold would be a ho hum event, but given Steve "worked for the Reserve Bank of Australia (RBA) as a senior Bank Analyst and studied the sale and leasing of RBA’s gold reserves" from 1996 to 1998, I think this blog is a must add to your watch list. While I doubt Steve will be able to give any direct comment on the RBA's sale of two thirds of Australia's gold reserves, which happened during his time there (given central bank employment confidentiality agreements are probably signed in blood or something) it will no doubt give him a unique perspective on the gold market and you never know, he might inadvertently let something slip.
Normally another blogger on gold would be a ho hum event, but given Steve "worked for the Reserve Bank of Australia (RBA) as a senior Bank Analyst and studied the sale and leasing of RBA’s gold reserves" from 1996 to 1998, I think this blog is a must add to your watch list. While I doubt Steve will be able to give any direct comment on the RBA's sale of two thirds of Australia's gold reserves, which happened during his time there (given central bank employment confidentiality agreements are probably signed in blood or something) it will no doubt give him a unique perspective on the gold market and you never know, he might inadvertently let something slip.
11 November 2014
If gold in a forest is withdrawn by a wholesaler and no one is around to buy it, does it make the price move?
One project I’m currently working on at the Perth Mint is the replacement of our website. This involves topics like SEO, “authority”, page rank etc and how to achieve such. It’s hard not to get cynical about it, particularly when you come across tips for “Ultimate Headlines” like:
As has happened every time gold has experienced a large fall in the past, most of the gold blogosphere was out with their reassuring talk because that is what sells – confirmation you made the right decision. Central to a lot of that was the idea that “real” demand was shockingly high. Before I address that, some off-topic ramblings to get out of the way:
Ramble #1: To answer my own question, no, Comex kilobar withdrawals don’t “works as an indicator of a bottom” in the medium term :P Whilst I did note a lack of “any positive narrative developing around gold that would drive big fund money” and that “the strong dollar story is the biggest risk to gold breaking $1180” the fact is I didn’t call the drop, primarily because Perth Mint was still seeing good kilobar demand and premiums and I thought that the Chinese would be enough to support the market (kilobar premiums have increased on this drop BTW, so recent Chinese demand stories are not just permabull BS). It seems my advice on the 18th of September that “you might want to trade against” my call, was the right trade. Anyway, I’ll continue on with my “predictions” not because I’m trying to be a guru, but to provide an alternative view using data points (eg kilobar premiums, market narratives) that others don’t which you can factor into your own decision making process.
Ramble #2: If you’re not seeking reassurance, which probably means you bought gold for insurance and it is only has a modest weighting in your portfolio, these posts are worth reading for an alternative to the current permabull memes:
Ramble Ends
One of the most enduring permabull memes is the physical-paper disconnect. I’d suggest what the permabulls are now experiencing with their declining sales/subscriptions and need to turn off comments on their blogs/forums is a permabull-price disconnect. The gold price has disconnected from their constant stories that “demand” for gold is strong. The readers are asking questions and thinking heretical thoughts.
The problem stems from a simplistic idea of what demand is, as well as selective focus on positive demand reports and ignoring negative reports. The game of internet marketing requires dumbing issues down into 65 character headline stories easily understood by lay readers. Taking a nuanced approach by delving into the detail is counterproductive because it introduces ambiguity and requires the reader to think, hard, when what they want is comforting reassurance. It just leads down a path with lots of unanswerable questions and denies the writer the ability to craft dramatic self-assured headlines.
As an example, consider the difference between wholesale market withdrawals versus end consumer demand. The point of the headline to this post is that withdrawals by a wholesale participant (eg jeweller) may or may not be reflective of demand that will actually affect the price. If the purchase by the wholesale user is offsetting sales to consumers, then the wholesale movements are reflective of price-affecting demand. However, if the wholesale user is stocking (or destocking), then they would hedge that acquisition and the impact on the price would be zero. How much of the Comex or SGE movements are price responsive or price neutral? We don’t know for sure.
For an example of this issue, consider the World Gold Council’s quarterly Gold Demand Trends report. This has two jewellery demand figures – fabrication and consumption (which “is equal to fabrication plus/minus jewellery imports/exports plus/minus stocking/de-stocking”). It is worth also looking at page 16 of the 2014 Q2 report where they discuss the difficulties of estimating supply and demand figures, highlighting the difference in Chinese jewellery fabrication demand between CPM Group, Metals Focus and GFMS.
Then you have the issue of manipulation, where someone could move stock between visible exchanges/warehouses and OTC opaque vaults to give the impression of strong demand or excess supply. Then add in the use of gold in speculative cross-border arbitrage or commodity financing deals and we have some uncertainty as to what "real" demand is.
The above is the reason I don’t look at total Comex movements and instead focus on kilobar movements only, as it is a highly specific product in demand in a specific region. Even so, it is not an entirely reliable metric, although I suppose I should follow the fashion of the day and instead of blaming myself, blame the bullion banks who found out I had shone a light on their otherwise secretive activities and when their dis-info agents failed to convince people that my kilobar theory was wrong and the suspiciously rounded figures were just fraudulent, they purposefully moved kilobars out of Comex into their unseen OTC vaults to discredit me and stop people from paying attention to the numbers.
Finally, even if we could get accurate figures, as Robert Blumen explains in this excellent article, quantities demanded (and therefore supplied) have “no causal connection with the gold price”. The problem with Robert’s analysis for our permabull writers is that his true drivers of the gold price - supply and demand schedules – “are not scalar quantities and cannot be measured; they can only be observed indirectly through the gold price itself”. Ouch, that won’t do, the price fell and they need analysis that proves the falling gold price was “wrong”.
I would take issue with Robert’s statement that investor schedules can’t be measured – on exchange traded products the depth of bids and offers, and how they change over time, give some limited insight into these preferences. Unfortunately such data in the gold market is limited, but highly important. Consider if you heard that a quantity of one home was bought in your street for $100,000 during the last month. That is useful, but it would be more useful to know that only one home was up for auction during that period and there were five people bidding for it. However, your view of that one $100,000 sale would change if you were told instead that three homes were auctioned and there were only one or two bidders per home.
Robert’s article also addresses the flow/stock issue, which I covered in this post noting that “what drives the gold price I would therefore argue, is not so much demand, but to what extent existing holders of the 170,000t will withhold it from the market”. Even so, the price as set by the marginal buyer and marginal seller affect, in sort of feedback loop, the behaviour of the existing holders. For example, everyone in the street sees that one $100,000 sale and thinks their home is worth around $100,000, but should a fair proportion of them attempt to sell their homes, the chance of them all getting $100,000 will be slim and the price would fall. That might not happen if they had information that the number of homes auctioned was three and the number of bidders was poor.
I also think that while Robert is logically correct that quantities have no causal connection, he is underplaying the fact that people believe they do, or probably more accurately, people believe everyone else believes they do. Robert also notes that “trading continues because people are always changing their minds about what they want to own” but his article doesn’t consider what influences people to change their minds.
The conclusion is that the relationship between price and demand is complex and ambiguous, subject to feedback loops and human interpretation. That is why I’ve taken to Ben Hunt’s game/narrative theory approach.
So where are we now? While we have seen reports of retail demand surges, mostly silver, and the Perth Mint’s kilobars premiums have moved up from previous strong levels, the fact is that Western professional market selling has overwhelmed China and other sources of demand. Perth Mint has seen a little selling from Depository clients, but nothing of note but not any surge in buying. We are not getting the same retail reaction we did on the April 2013 drop. From a technical point of view I get much confidence in drawing lines from chart levels over 5 years old – investor circumstances/perceptions have changed. Until we see Western money move back into gold we won’t get any sustained and meaningful price move. On that front the pro market narrative is all negative:
Bloomberg: “There’s just not one typical investment idea that’s supportive to gold right now,” George Zivic, a New York-based portfolio manager at Oppenheimer Funds Inc., which oversees $245 billion, said by phone Nov. 5. “With the potential of rates increasing, dollar appreciation, it becomes synthetically expensive to hold gold as some sort of a portfolio hedge. And then you have the reality of no real concerns of inflation.”
Mineweb: Half of the 27 respondents surveyed on Wednesday and Thursday predicted gold prices will breach a critical support at $1,100 per ounce by the end of this year. ... "U.S. dollar strength should impact gold on a short-term basis," said John Meyer, analyst at brokerage SP Angel. ... "The drivers of a sustained rally in gold are ephemeral at best," said Tai Wong, director, metals trading at BMO Capital Markets in New York. ... "The mood of investors could not be more bearish for precious metals," said Thorsten Proettel, commodity analyst at LBBW.
I quote these guys not because I think they know what they are talking about, but because this is what similar pro investors are reading and what they think everyone else thinks about gold. On that basis the outlook is poor and in uncharted territory. Sorry. We’ll just have to sit and watch how this plays out over the next few months.
- Maximum character count is 65 before being cut off in search results
- Numbers + Adjective + Target Keyword + Rationale + Promise; Ex. 10 Simple Steps You Can Take Today That Will Make You Happier
- [Adjective] & [Adjective] [SEO Keyword Phrase] That Will [Highly Desirable Promise of Results]; Ex. New and Useful Content Marketing Trends That Will Drive You More Traffic
- Paul Craig Roberts and the Spread of Disinformation
- Gold Bug Psychology Must be Neutered
- Metals Perpetually Suppressed?
- Gilded Cage
Subscribe to:
Posts (Atom)